Inventories in the data warehouse
A reliable recipe for representing inventories in the data warehouse.
Every business manages inventories, even if your product isn’t physical. Great data about these inventories is critical for effectively managing them, avoiding necessary costs, and wowing customers. However, inventory reporting depends on data that is structured differently from typical transactional reporting. Getting the inventory data model right can be tricky, but it’s a well-trodden path where we can look to proven patterns.
In brief
Here’s a simple and bulletproof recipe for batch-materializing tables to describe inventories:
- Have a reliable source for the history of transactional records. Raw table snapshots are probably the best option.
- Establish the relevant timeframes to measure (every second, hourly, daily, weekly, etc.) and the instants that represent each timeframe (e.g., 11:59:59pm daily).
- Find relevant dimensions for your table. I.e., the most common reporting aggregations you’ll want your table to support.
- Define the grain of your table. This is, at least, the cross-join of the timeframe and a dimension that describes the unit of the business process (e.g., SKUs).
You can skip to the detail if that’s all you’re looking for.
“Inventory”
I’d bet you’ve thought of a warehouse full of stacks or bins. Inventory indeed!
Any business process that isn’t instantaneous has inventory too - for example:
- If you have a phone system, you have inventories of callers: those in the queue, connected, on hold, etc.
- You might have inventories of customer support cases waiting to be resolved
- Account Executives manage inventories of leads and active accounts
- Your website has an inventory of active visitors, the people browsing it right now
- If your site has a cart and check-out, you’re sitting on an inventory of to-be-purchased carts
The list goes on. Anywhere that processes include dwell or wait time, you have an inventory. Some of those inventories will be of great interest to the staff that manage them, and you can provide them with great tools for tracking and analyzing their inventories.
What’s at stake
Typical transactional reporting (throughput, conversion, velocity) provides an incomplete picture of many business processes, and can mask real issues.
Consider a claims-processing department at an insurance provider. This year, there is a lot to celebrate:
- More claims were processed than ever before
- Claim processing times have fallen
- The per-claim-payout has also fallen
- Customer NPS following claim resolution is rising
The killer strategy that made this happen: The claims team has been focusing on small, straightforward claims.
However, there are real losses, even if not yet realized or measured:
- Customers are losing out. Those who may be most in need of prompt service are being de-prioritized.
- Large claims that sit unresolved are more likely to litigate - raising both the expected per-claim-payout and adding unnecessary legal expense.
- When the claims team eventually comes to the bigger claims, they’ll be faced with frustrated and challenging customers.
You may think this is a contrived and unlikely example. It’s not. I worked with this very claims team in my time as a consultant.
The team was led by thoughtful, capable, and kind people who cared about customers. However, leaders lacked access to any information about the inventory of claims to be worked. They had rich information about claims throughput, and so built their reporting and incentives around moving more claims to resolution faster. Tackling the aging backlog of complex claims required simply exposing relevant facts to team leaders and claims agents.
A reliable inventory recipe
0. Understand the process
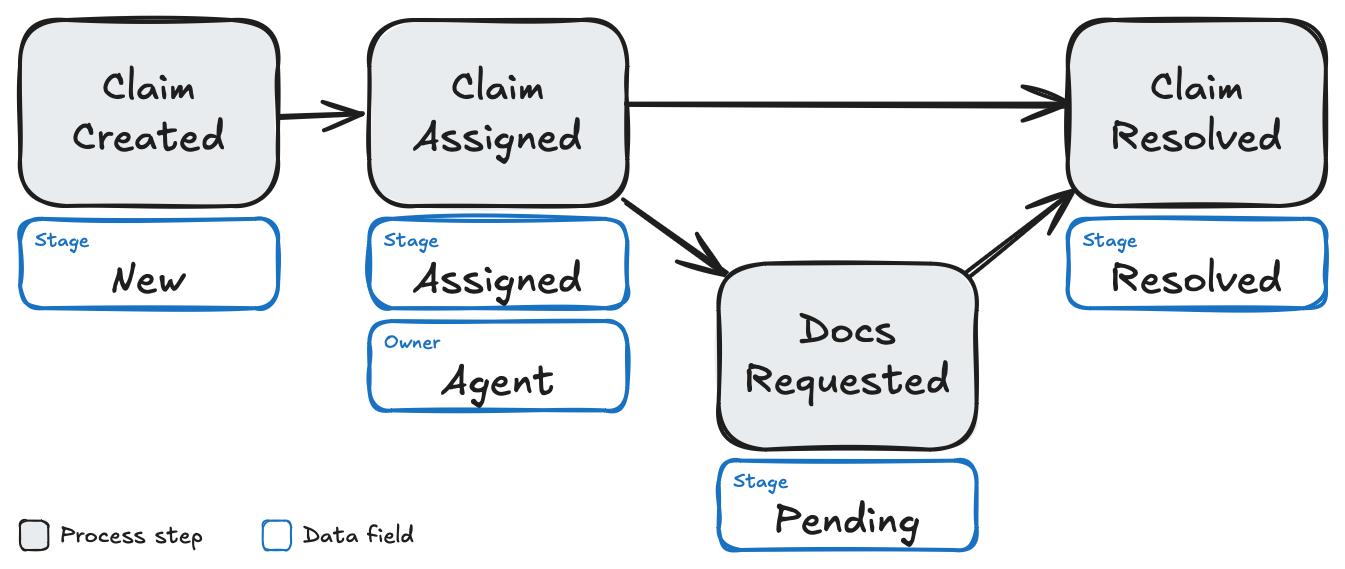
A pre-requisite for any data model is an understanding of the business process you’re modeling. For the sake of exposition, let’s run with our claims processing example:

Claims resolution process
We’ll be using the Stage field on a source table that describes each Claim as a row.
The Stage is updated as the Claim moves through the process.
Additionally, we’ll have available an Owner field that tells us which agent is responsible for working each claim.
1. Find or build state history
We need to have a reliable source for describing the state of each Claim over time.
You’ll typically have two potential paths:
- Sufficient information is available from a system of record (e.g., if there are timestamp data fields that describe the state transitions you’re interested in). In my experience, this is quite rare.
- Capture the state of a system-of-record over time in a periodic snapshot table. In my work, I always implement these snapshots, even when not immediately needed. Having a full-fidelity history of state is awesome!
2. Define intervals
There are likely a variety of intervals over which it will be useful to analyze your inventories. The selection of these intervals is most influenced by how quickly units move through the process. We’ll also want to select a few less granular intervals that make it easy to address common reporting questions.
As a reliable starting point: choose your finest interval to be 5-10x smaller than the smallest interval in your process.
For our claims-processing example, we might choose to construct our claims inventory table to support the following intervals:
| Interval | Instant to be measured | Description |
|---|---|---|
| 5 minutes | 00:00:00, 00:05:00, 00:10:00, … |
The fastest state change for a claim takes about an hour (initial assignment). A 5-minute interval is ~10x smaller than this shortest process interval. |
| Day | 00:00:00 every day |
Knowing the status of inventory at the same time every day supports a KPI that the claims team wants to use about maximum daily backlog. |
| Week | 00:00:00 every Monday |
The status of inventory at the start of the week helps the claims team plan capacity for that week (e.g., authorizing overtime). |
| Month | 00:00:00 the 1st of the month |
Monthly trends are a common view for KPIs across the business. |
3. Identify dimensions
Dimensions allow for easy aggregation of your data for reporting and analysis. There are likely a handful of natural and commonly-used dimensions you’ll want to include in your inventory table.
For our claims process, we have two:
Stage: Where in the process is did each claim sit at a given time?Owner: Who is the agent responsible for processing the claim?
4. Define the grain
The grain of your table establishes the finest resolution at which users will be able to dissect data. My guidance is to resist the urge to aggregate and instead use the finest grain possible. Aggregation is a performance and cost optimization that is really only relevant to the 0.1% of organizations with truly huge data.
For the claims process, the grain will be the cross product of the 5-minute interval measurement times and each claim.
4. Deliver!
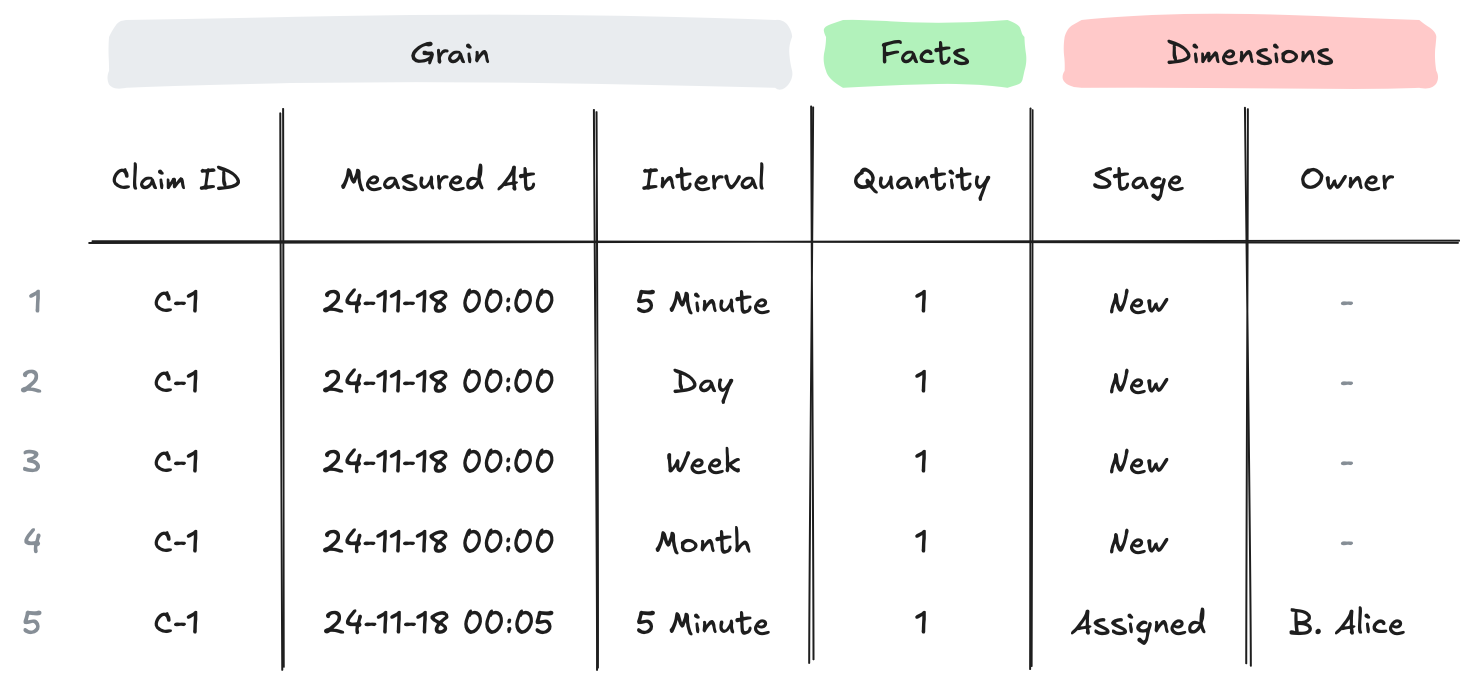
In the end, you’re building a table that will look something like the one below. The transformations needed to get there depend on your source for history.

Basic claims inventory table
A few features of the table that are worth calling out:
- An observation will be repeated across multiple rows when different intervals share an observation time (e.g., rows 1-4).
- Aggregation (counts, sums, averages) always require filtering to a single value in the
Intervalfield. - Changes that occur faster than interval won’t be visible. I.e., this isn’t a history table - it’s intended to measure inventories at specific instants.
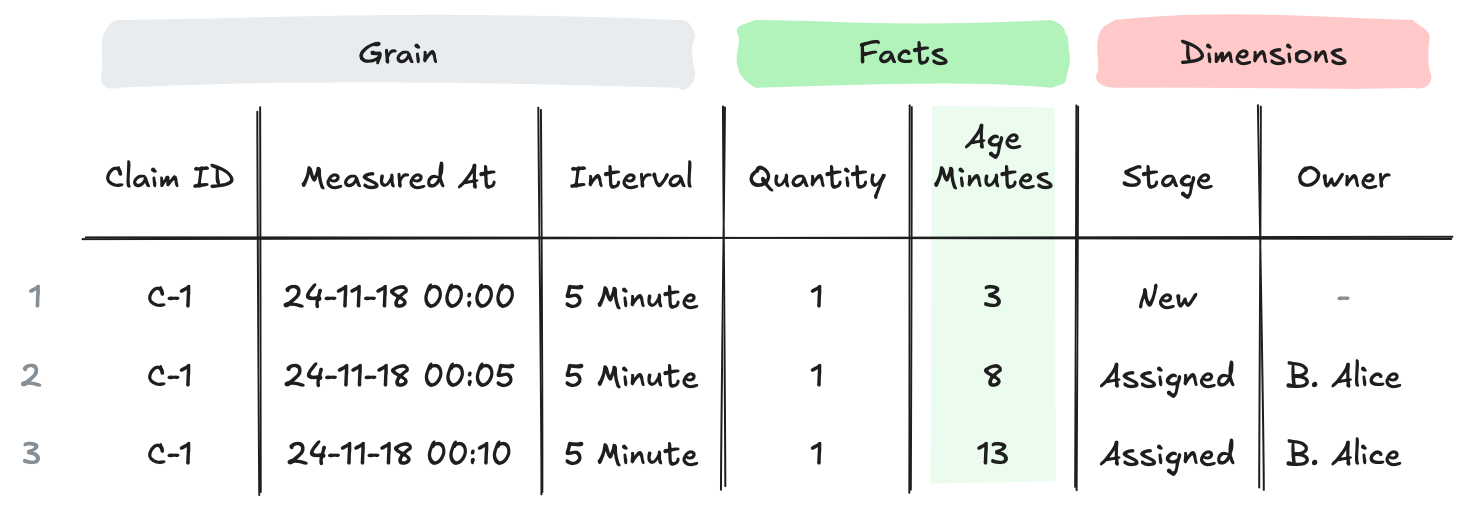
You’re not restricted to quantity facts. For example, to expose the age of each claim over time, you could add an age fact:

Claims inventory table with additional Age fact
This readily enables answering questions like “What was the average age of claims in the New stage over the course of the day?”
SELECT
    measured_at,
    AVG(age_minutes) AS average_age_minutes
FROM claims_inventory
WHERE
    interval = 'Hour'
    AND stage = 'New'
GROUP BY measured_at
ORDER BY measured_at
So what?
The three things I hope you take away from reading this:
- Inventory is an important measure within a business, and merits easy access through purpose-built tables in a data warehouse.
- A table that describes inventory is different from transaction tables and historical snapshots.
- There’s no need to try to invent a solution from scratch. While your needs will require modifications, this recipe is a good starting point.
Thanks for taking the time to read!